Teaser solution
The task is to provide an easy-to-read map for recruiters to find the top analyst. This was one of the interview quiz from Zalando.
Table of content
- Table of content
- Result
- Computations
- Define a search space
- Translation between GPS and coordinate
- Distance of a point to a line segment
- Probability of a point based on river Spree
- Probability of a point based on Brandenburg gate
- Probability of a point based on satellite track
- Compute the joint probability
- Rank points by probabilities
- Plot heatmaps
- Complete Code (link to code)
Result
Permanent links to code and solution
-
Permanent link to this solution page is
http://www.hongyusu.com/programming/2015/10/29/teaser-solution/
-
Permanent link to codes in Github is
Overview
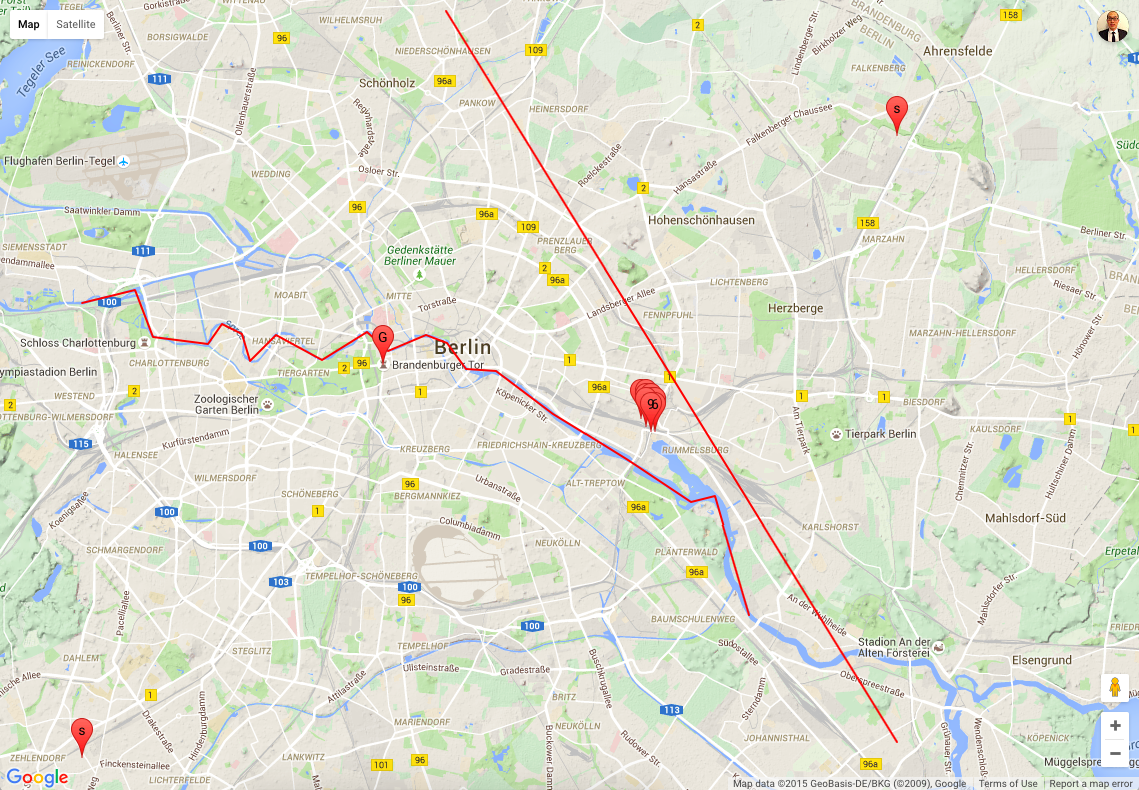
- An overview of the possible locations are shown on the following map in which
- Two points in the bottom left and upper right corners define the search space.
- The river Spree, the Brandenburg gate, and the satellite track are also shown on the map.
- 5 most possible locations for the top analyst are shown as a cluster of points on the map.
Probability density map
-
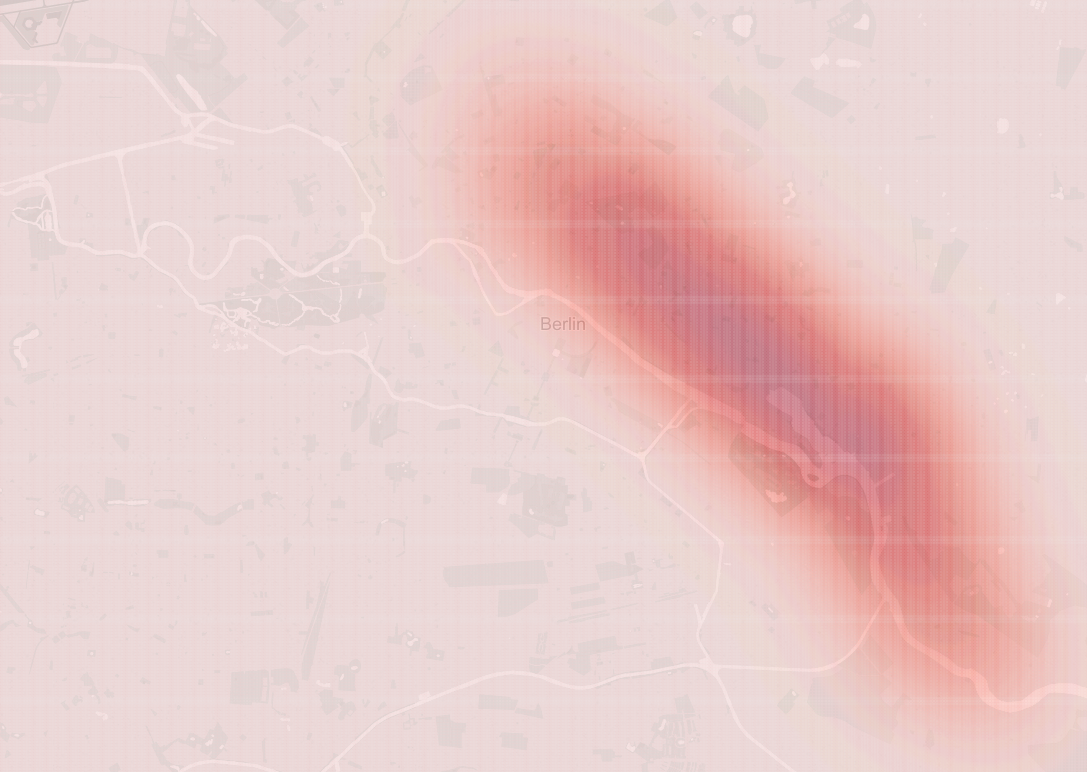
The following probability density map shows the probability of the top analyst appear on the real geographical map.
Locations in detail
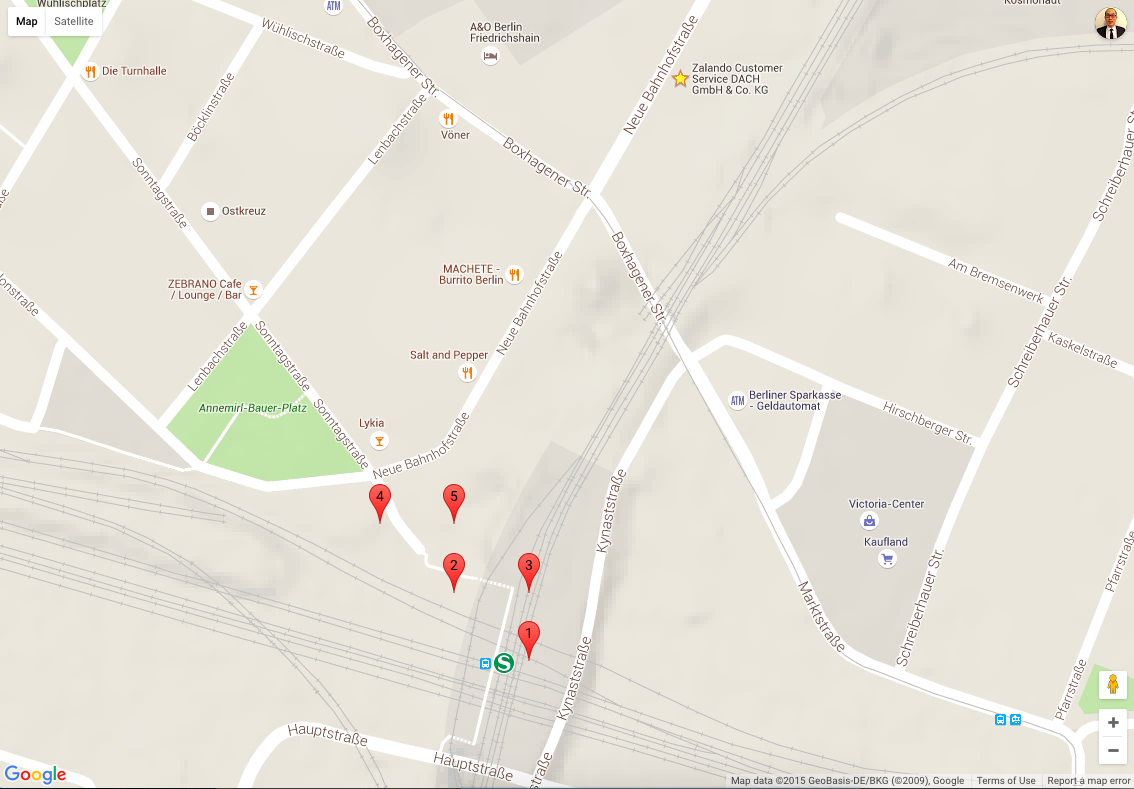
- When zoom into the cluster of possible locations, I have the following map showing more details
- Possible locations where the top analyst would appear are ranked according to the joint probabilities where small number 1 means more likely.
- The predicted most possible location (point 1) is in the Berlin Ostkreuz station.
- 4 other top locations are also around the Berlin Ostkreuz station meaning that the top analyst appears quite frequently in this station.
- It is also interesting to see that there is a Zalando office not far from this stations. Therefore, the top analyst might already be hired by Zalando :relaxed:
GPS and probability
-
The following table shows the exact GPS coordinates for the top 5 locations
Rank Lat Lng Probability 1 52.503179096440086 13.469632312871738 0.0012240249165757003 2 52.503628239923465 13.468834217717159 0.0012238980867782902 3 52.503628239923465 13.469632312871738 0.001223494006603107 4 52.504077383406845 13.468036122562582 0.0012234305781397886 5 52.504077383406845 13.468834217717159 0.0012232741254169048
Computations
Define a search space
- After plotting the constraints (gate, river, satellite) on the map, I need to define a search space.
- Points in the search space are possible location the top analyst will most likely to appear.
- I define the search space as a rectangle region defined by a point on the bottom left corner (starting point) and a point on top right corner (stopping point).
-
The GPS coordinates of these two points are shown in the following table
Nick name Position Lat Lng Starting point Bottom left 52.434011 13.274099 Stopping point Top right 52.564011 13.554099
Translation between GPS and coordinate
- The following Python function translates from a GPS point to a point on orthogonal coordinate system. The origin of the system is the point on the bottom left corner of the search space.
-
It is worth noting that the GPS points given in the puzzle are not in degree, there is no need to normalized the number by \(\frac{\pi}{180}\).
def GPS2POS((lat,lng)): ''' transform from GPS to coordinate system (POS) ''' return ((lng-startGPS[1]) * math.cos(startGPS[0]) * 111.323, (lat-startGPS[0]) * 111.323) - The following Python function translates from a coordinate back to GPS.
def POS2GPS((x,y)):
'''
transform from coordinate system (POS) to GPS
'''
return (y/111.323+startGPS[0], x/111.323/math.cos(startGPS[0]) + startGPS[1])
Distance of a point to a line segment
- Given a coordinate of a point and a line segment in terms of starting and stopping points in orthogonal coordinate system, the following Python function compute the distance of the point to the line segment
def dist(x1,y1, x2,y2, x3,y3):
'''
compute distance from a point to line segment
x3,y3 is the point
'''
px = x2-x1
py = y2-y1
something = px*px + py*py
u =  ((x3 - x1) * px + (y3 - y1) * py) / float(something)
if u > 1:
  u = 1
elif u < 0:
  u = 0
x = x1 + u * px
y = y1 + u * py
dx = x - x3
dy = y - y3
dist = math.sqrt(dx*dx + dy*dy)
return dist
Probability of a point based on river Spree
- Based on river Spree, the probability of a point being a possible location is given by a Gaussian distribution on the distance of the point to river Spree.
- The mean of Gaussian is \(\mu=0\) and standard deviation is \(\delta=\frac{2.730}{1.96}\).
- The following Python function will compute the probability of a point being a possible location given the coordinate of the point and the coordinates of river Spree.
def prob_river(pointPOS,riverPOS): ''' compute probability according to Gaussian distribution base on river ''' mu = 0 delta = 2.730/1.96 min_d = 10e10 for i in range(1,len(riverPOS)): d = dist(riverPOS[i-1][0],riverPOS[i-1][1],riverPOS[i][0],riverPOS[i][1],pointPOS[0],pointPOS[1]) if min_d > d: min_d =d return min_d,norm.pdf(min_d,mu,delta) -
With 500 meter as resolution, I ended up with 1044 points in the search space. The distance and the probability of each point defined by river Spree are visualized in the following figure.
-
With 50 meter as resolution, I ended up with 101790 points in the search space. The position of each data point is transformed back to GPS system and the probabilities based on the river is plotted on the following map by Tableau.
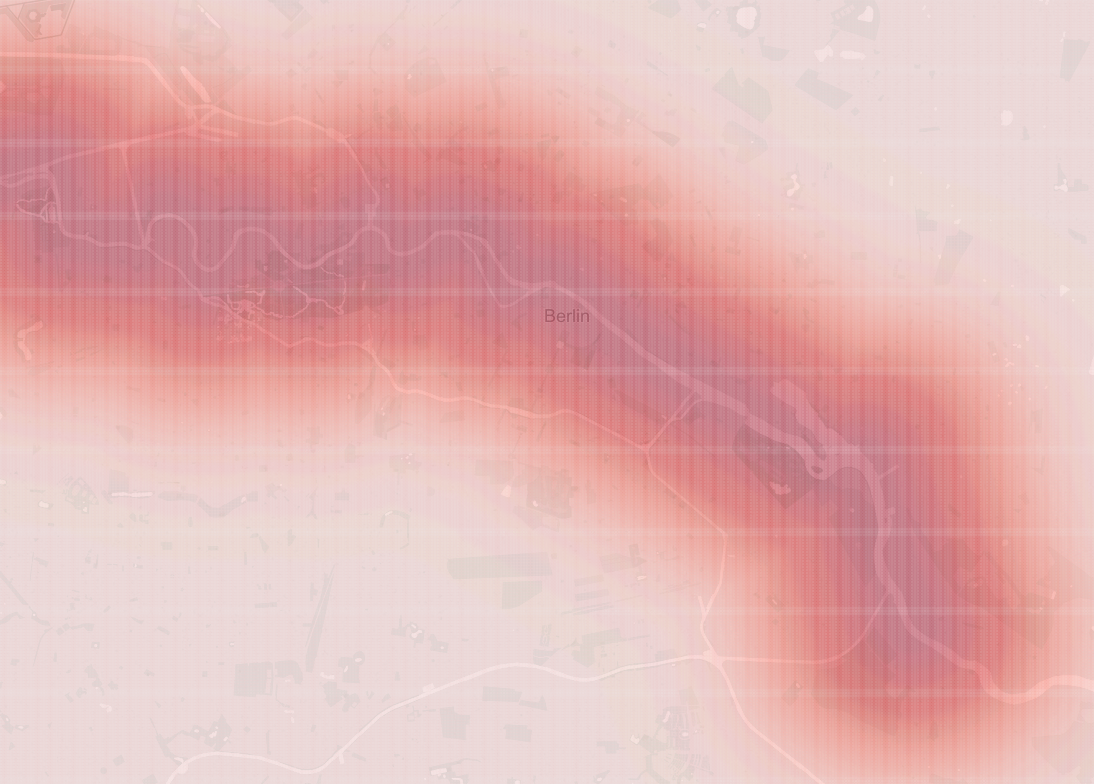
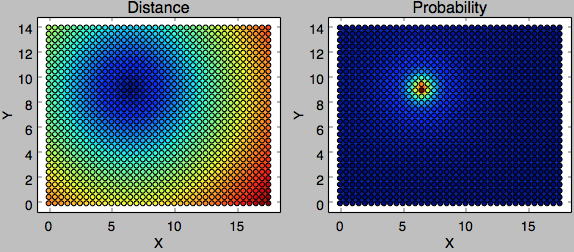
Probability of a point based on Brandenburg gate
- Based on Brandenburg gate, the probability of a point being a possible location is given by a log-normal distribution on the distance of the point to the gate.
-
In addition, given mean \(m_{mean}=4.700\) and model \(m_{mode}=3.877\) of the log-normal distribution, the Gaussian mean and standard derivation can be computed by the following equations
\[m_{mean} = \exp(\mu+\frac{\delta^2}{2})\] \[m_{mode} = \exp(\mu-\delta^2)\] - The following Python function will compute the probability of a point being a possible location, given the coordinate of the point and the coordinate of Brandenburg gate.
def prob_gate(pointPOS,gatePOS): ''' compute probability according to lognormal distribution base on gate ''' d = math.sqrt((gatePOS[0]-pointPOS[0])**2+(gatePOS[1]-pointPOS[1])**2) mu = (2*math.log(4.700) + math.log(3.877)) / float(3) delta = math.sqrt(2/3*(math.log(4.7)-math.log(3.877))) return d,lognorm.pdf(d,mu,delta) -
With 500 meter as resolution, I ended up with 1044 points in the search space. The distance and the probability of each point defined by Brandenburg gate are visualized in the following figure.
-
With 50 meter as resolution, I ended up with 101790 points in the search space. The position of each data point is transformed back to GPS system and the probabilities based on the gate is plotted on the following map by Tableau.
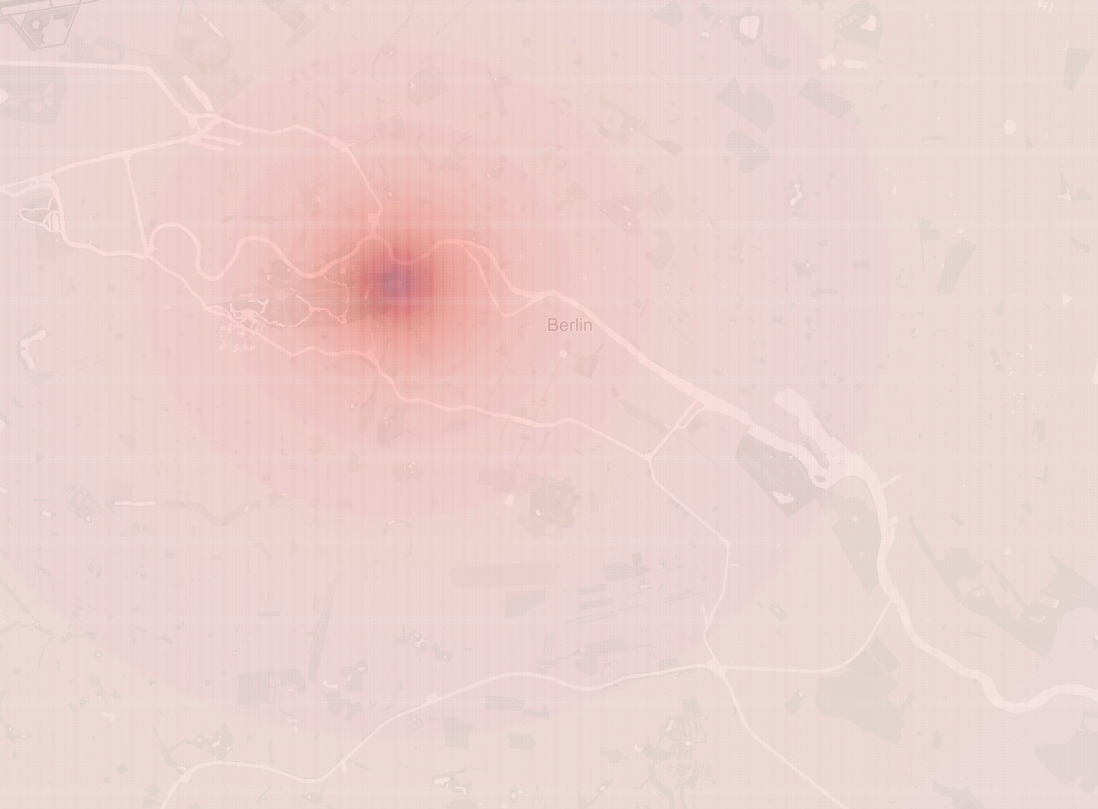
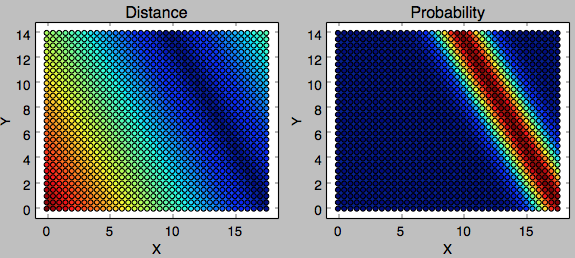
Probability of a point based on satellite track
- Based on the track of the satellite, the probability of a point being a possible location is given by a Gaussian distribution on the distance of the point to the track.
- I just assume the track of the satellite is a straight line on the map defined by its starting and stopping locations.
- The mean of Gaussian is \(\mu=0\) and the standard deviation is \(\delta = \frac{2.400}{1.96}\).
- The following Python function will compute the probability of a point being a possible location, given the coordinate of the point and the line segment of the satellite track.
def prob_satellite(pointPOS,satellitePOS): ''' compute probability according to Gaussian distribution for satellite ''' d = dist(satellitePOS[0][0],satellitePOS[0][1],satellitePOS[1][0],satellitePOS[1][1],pointPOS[0],pointPOS[1]) mu = 0 delta = 2.400/1.96 return d,norm.pdf(d,mu,delta) -
With 500 meter as resolution, I ended up with 1044 points in the search space. The distance and the probability of each point defined by the satellite track are visualized in the following figure.
-
With 50 meter as resolution, I ended up with 101790 points in the search space. The position of each data point is transformed back to GPS system and the probabilities based on the satellite track is plotted on the following map by Tableau.
Compute the joint probability
- So far, I am able to compute for each point \((x,y)\) in the search space the probabilities of being a possible location for the top analyst based on the river \(P_{river}((x,y))\), the gate \(P_{gate}((x,y))\), the satellite track \(P_{sat}((x,y))\) independently.
-
To actually determine if a point being a possible location, I need to compute the joint probability defined by the product of three independent probabilities according to the following equation
\[P((x,y)) = P_{river}((x,y)) \times P_{gate}((x,y)) \times P_{sat}((x,y))\] -
As a auxiliary measurement, I define the joint distance as the sum of the shortest distances
\[D((x,y)) = D_{river}((x,y)) + D_{gate}((x,y)) + D_{sat}((x,y))\] - The following Python function will compute the joint probability and the joint distance described above for each point in the search space.
def compute_joint_probability(ss,gatePOS,satellitePOS,riverPOS): ''' compute joint probability of all point in the search space ''' res = [] for pointPOS in ss: gateD,gateP = prob_gate(pointPOS,gatePOS) satelliteD,satelliteP = prob_satellite(pointPOS,satellitePOS) riverD,riverP = prob_river(pointPOS,riverPOS) try: res.append([pointPOS[0],pointPOS[1],gateD,gateP,satelliteD,satelliteP,riverD,riverP,gateD+satelliteD+riverD, gateP*satelliteP*riverP]) except Exception as error: print error return np.array(res) -
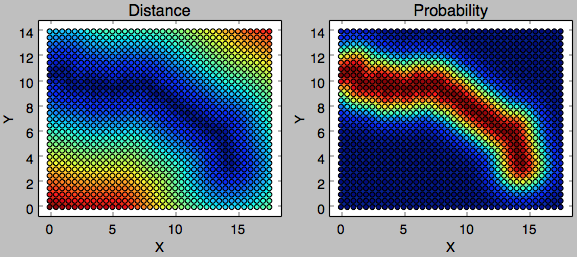
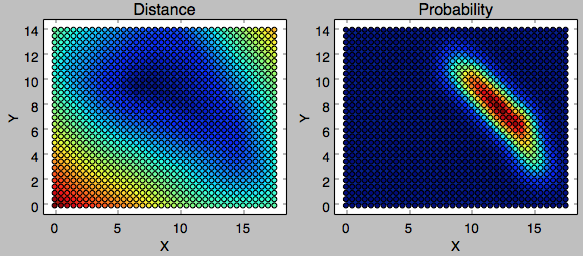
With 500 meter as resolution, I ended up with 1044 points in the search space. The distance and the probability of each point jointly defined by the river, the gate, and the track are visualized in the following figure.
-
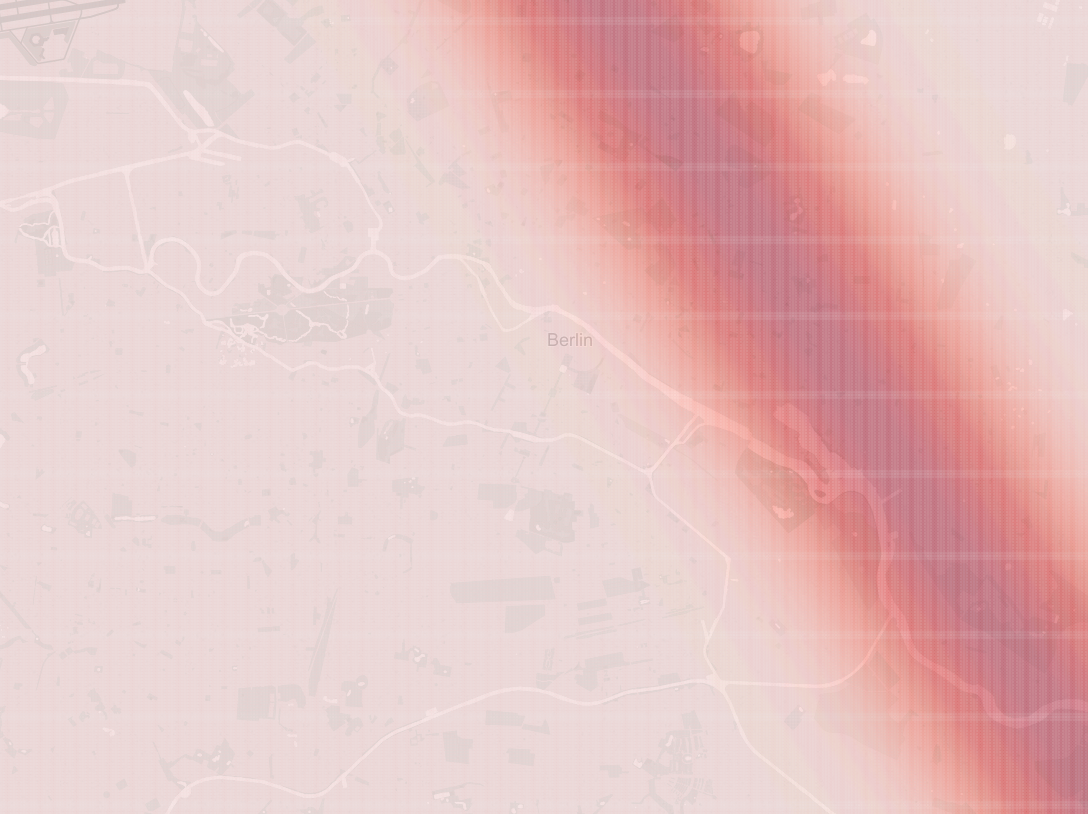
With 50 meter as resolution, I ended up with 101790 points in the search space. The position of each data point is transformed back to GPS system and the joint probability is plotted on the following map by Tableau.
- The result indicates that the search should focus on the elongated region on the map highlighted by the probability density.
Rank points by probabilities
- With the approach described above, I am able to provide a probability density map for searching the top analyst.
- However, the map still cover a relative large area, which could be a big problem if Zalando does not have enough human power of recruiters to search for this top analyst :laughing:
- Therefore, I rank all points in the search space according to their joint probabilities. In particular, a resolution of 50 meter is used in this calculation which ends up with 101790 points in the search space.
-
The GPS coordinate of the top 5 candidate locations are shown in the following table together with the joint probabilities.
Rank Lat Lng Probability 1 52.503179096440086 13.469632312871738 0.0012240249165757003 2 52.503628239923465 13.468834217717159 0.0012238980867782902 3 52.503628239923465 13.469632312871738 0.001223494006603107 4 52.504077383406845 13.468036122562582 0.0012234305781397886 5 52.504077383406845 13.468834217717159 0.0012232741254169048 -
I further plot the point on the following map in which points are labelled by ranks.
It is interesting to see that the best point is in Berlin Ostkreuz station and all other top points are also around this station, and there is a Zalando office near that station (star marker on the top of the map). This probably means that the top analyst is most likely to appear around the Ostkreuz station. If there is any connection already with Zalando, she would probably work in this particular Zalando office :relaxed:
-
The following Python code will perform ranking and generate a HTML with Javascript to visualize points on the Google map.
def show_result(res):
'''
show results on google map
'''
res    = res[np.lexsort((res[:,-1],))] # sort point by probability
s      = ''
for line in open('head') : s+=line
for i in range(1,6):
  pointGPS = POS2GPS((res[-i,0],res[-i,1]))
  print i,pointGPS,res[-i,[3,5,7,9]].tolist()
  s += '[ %.6f,%.6f,%d],\n' % (pointGPS[0],pointGPS[1],i)
for line in open('tail') : s+=line
open('map.html','w').write(s)
Plot heatmaps
-
In addition, heatmaps in terms of distances or probabilities shown above are generated from the following Python function.
def plot_res(res):
ind = 0
for i in range(2,10):
  ind += 1
  x,y,z = np.transpose(res[:,[0,1,i]])
  x=-x
  # Set up a regular grid of interpolation points
  xi, yi = np.linspace(x.min(), x.max(), 100), np.linspace(y.min(), y.max(), 100)
  xi, yi = np.meshgrid(xi, yi)
  # Interpolate
  rbf = scipy.interpolate.Rbf(x, y, z, function='linear')
  zi = rbf(xi, yi)
  # plot
  subplot = plt.subplot(4, 2, ind)
  if i%2 ==0:
    subplot.set_title("Distance")
  else:
    subplot.set_title("Probability")
  subplot.imshow(zi, vmin=z.min(), vmax=z.max(), origin='lower',extent=[x.min(), x.max(), y.min(), y.max()])
  subplot.scatter(x, y, c=z)
  subplot.set_xlabel('X')
  subplot.set_ylabel('Y')
plt.show()
pass
Complete Code (link to code)
- An up-to-date solution can be found from my GitHub.
- The complete Python code as well as html header and tail codes are shown as follows.
- Python code
import math
import numpy as np
from scipy.stats import norm
from scipy.stats import lognorm
import matplotlib.pylab as plt
import scipy.interpolate

# data as global variable
riverGPS     =[
  (52.529198,13.274099),
  (52.531835,13.29234),
  (52.522116,13.298541),
  (52.520569,13.317349),
  (52.524877,13.322434),
  (52.522788,13.329),
  (52.517056,13.332075),
  (52.522514,13.340743),
  (52.517239,13.356665),
  (52.523063,13.372158),
  (52.519198,13.379453),
  (52.522462,13.392328),
  (52.520921,13.399703),
  (52.515333,13.406054),
  (52.514863,13.416354),
  (52.506034,13.435923),
  (52.496473,13.461587),
  (52.487641,13.483216),
  (52.488739,13.491456),
  (52.464011,13.503386)]

satelliteGPS = [
  (52.590117,13.39915),
  (52.437385,13.553989)]

gateGPS      = (52.516288,13.377689)
startGPS     = (52.434011,13.274099)
stopGPS      = (52.564011,13.554099)


def dist(x1,y1, x2,y2, x3,y3):
  '''
  compute distance from a point to line segment
  x3,y3 is the point
  '''
  px = x2-x1
  py = y2-y1
  something = px*px + py*py
  u =  ((x3 - x1) * px + (y3 - y1) * py) / float(something)
  if u > 1:
    u = 1
  elif u < 0:
    u = 0
  x = x1 + u * px
  y = y1 + u * py
  dx = x - x3
  dy = y - y3
  dist = math.sqrt(dx*dx + dy*dy)
  return dist

def prob_river(pointPOS,riverPOS):
  '''
  compute probability according to Gaussian distribution base on river
  '''
  mu    = 0
  delta = 2.730/1.96
  min_d = 10e10
  for i in range(1,len(riverPOS)):
    d = dist(riverPOS[i-1][0],riverPOS[i-1][1],riverPOS[i][0],riverPOS[i][1],pointPOS[0],pointPOS[1])
    if min_d > d: min_d =d
  return min_d,norm.pdf(min_d,mu,delta)

def prob_gate(pointPOS,gatePOS):
  '''
  compute probability according to lognormal distribution base on gate
  '''
  d       = math.sqrt((gatePOS[0]-pointPOS[0])**2+(gatePOS[1]-pointPOS[1])**2)
  mu      = (2*math.log(4.700) + math.log(3.877)) / float(3)
  delta   = math.sqrt(2/3*(math.log(4.7)-math.log(3.877)))
  return d,lognorm.pdf(d,mu,delta)

def prob_satellite(pointPOS,satellitePOS):
  '''
  compute probability according to Gaussian distribution for satellite
  '''
  d = dist(satellitePOS[0][0],satellitePOS[0][1],satellitePOS[1][0],satellitePOS[1][1],pointPOS[0],pointPOS[1])
  mu    = 0
  delta = 2.400/1.96
  return d,norm.pdf(d,mu,delta)

def GPS2POS((lat,lng)):
  '''
  transform from GPS to coordinate system (POS)
  '''
  return ((lng-startGPS[1]) * math.cos(startGPS[0]) * 111.323, (lat-startGPS[0]) * 111.323)

def POS2GPS((x,y)):
  '''
  transform from coordinate system (POS) to GPS
  '''
  return (y/111.323+startGPS[0], x/111.323/math.cos(startGPS[0]) + startGPS[1])

def transformation(riverGPS,satelliteGPS,gateGPS,startGPS,stopGPS):
  '''
  wrapper function to transform the distance from GPS to locations POS
  '''
  gatePOS  = GPS2POS(gateGPS)
  startPOS = GPS2POS(startGPS)
  stopPOS  = GPS2POS(stopGPS)
  satellitePOS = [ GPS2POS(point) for point in satelliteGPS ]
  riverPOS = [ GPS2POS(point) for point in riverGPS ]
  return riverPOS,satellitePOS,gatePOS,startPOS,stopPOS

def plot_res(res):
  ind = 0
  for i in range(2,10):
    ind += 1
    x,y,z = np.transpose(res[:,[0,1,i]])
    x=-x
    # Set up a regular grid of interpolation points
    xi, yi = np.linspace(x.min(), x.max(), 100), np.linspace(y.min(), y.max(), 100)
    xi, yi = np.meshgrid(xi, yi)
    # Interpolate
    rbf = scipy.interpolate.Rbf(x, y, z, function='linear')
    zi = rbf(xi, yi)
    # plot
    subplot = plt.subplot(4, 2, ind)
    if i%2 ==0:
      subplot.set_title("Distance")
    else:
      subplot.set_title("Probability")
    subplot.imshow(zi, vmin=z.min(), vmax=z.max(), origin='lower',extent=[x.min(), x.max(), y.min(), y.max()])
    subplot.scatter(x, y, c=z)
    subplot.set_xlabel('X')
    subplot.set_ylabel('Y')
  plt.show()
  pass

def compute_joint_probability(ss,gatePOS,satellitePOS,riverPOS):
  '''
  compute joint probability of all point in the search space
  '''
  res = []
  for pointPOS in ss:
    gateD,gateP            = prob_gate(pointPOS,gatePOS)
    satelliteD,satelliteP  = prob_satellite(pointPOS,satellitePOS)
    riverD,riverP          = prob_river(pointPOS,riverPOS)
    try:
      res.append([pointPOS[0],pointPOS[1],gateD,gateP,satelliteD,satelliteP,riverD,riverP,gateD+satelliteD+riverD, gateP*satelliteP*riverP])
    except Exception as error:
      print error
  return np.array(res)

def show_result(res):
  '''
  show results on google map
  '''
  res    = res[np.lexsort((res[:,-1],))] # sort point by probability
  s      = ''
  for line in open('head') : s+=line
  for i in range(1,6):
    pointGPS = POS2GPS((res[-i,0],res[-i,1]))
    print i,pointGPS,res[-i,[3,5,7,9]].tolist()
    s += '[ %.6f,%.6f,%d],\n' % (pointGPS[0],pointGPS[1],i)
  for line in open('tail') : s+=line
  open('map.html','w').write(s)


def find_her():
  '''
  the function is designed to output locations and probabilities
  '''

  # transformation from GPS to relative distance
  riverPOS,satellitePOS,gatePOS,startPOS,stopPOS = transformation(riverGPS,satelliteGPS,gateGPS,startGPS,stopGPS)

  # define a search space of points, with scale KM as interval
  scale = 0.05
  scale = 0.5
  ss    = [(x,y) for x in np.arange(startPOS[0],stopPOS[0],-scale) for y in np.arange(startPOS[1],stopPOS[1],scale)]
  print "Number of sample points:\t", len(ss)

  # compute statistics: x,y,dist_gate,prob_gate,dist_satellite,prob_satellite,dist_river,prob_river,sum of distance,joint probability
  res = compute_joint_probability(ss,gatePOS,satellitePOS,riverPOS)

  # plot
  plot_res(res)

  # output
  show_result(res)

  pass


if __name__ == '__main__':
  find_her()
- HTML header
<!DOCTYPE html>
<html>
  <head>
    <meta name="viewport" content="initial-scale=1.0, user-scalable=no">
    <meta charset="utf-8">
    <title>Simple Polylines</title>
    <style>
      html, body {
        height: 100%;
        margin: 0;
        padding: 0;
      }
      #map {
        height: 100%;
      }
    </style>
  </head>
  <body>
    <div id="map"></div>
    <script>

function initMap() {
  var gateGPS = {lat: 52.516288,lng:13.377689};
  var startGPS = {lat: 52.434011, lng: 13.274099};
  var stopGPS = {lat: 52.564011, lng: 13.554099};
  var map = new google.maps.Map(document.getElementById('map'), {
    zoom: 3,
    center: gateGPS,
    mapTypeId: google.maps.MapTypeId.TERRAIN,
    zoom:13
  });
  var marker = new google.maps.Marker({
      position: gateGPS,
      map: map,
      label: 'Gate'
    });
  var marker = new google.maps.Marker({
      position: startGPS,
      map: map,
      label: 'start'
    });
  var marker = new google.maps.Marker({
      position: stopGPS,
      map: map,
      label: 'stop'
    });

  var riverGPS = [
{lat: 52.529198, lng: 13.274099},
{lat: 52.531835, lng: 13.29234},
{lat: 52.522116, lng: 13.298541},
{lat: 52.520569, lng: 13.317349},
{lat: 52.524877, lng: 13.322434},
{lat: 52.522788, lng: 13.329},
{lat: 52.517056, lng: 13.332075},
{lat: 52.522514, lng: 13.340743},
{lat: 52.517239, lng: 13.356665},
{lat: 52.523063, lng: 13.372158},
{lat: 52.519198, lng: 13.379453},
{lat: 52.522462, lng: 13.392328},
{lat: 52.520921, lng: 13.399703},
{lat: 52.515333, lng: 13.406054},
{lat: 52.514863, lng: 13.416354},
{lat: 52.506034, lng: 13.435923},
{lat: 52.496473, lng: 13.461587},
{lat: 52.487641, lng: 13.483216},
{lat: 52.488739, lng: 13.491456},
{lat: 52.464011, lng: 13.503386},
];
 var flightPath = new google.maps.Polyline({
    path: riverGPS,
    geodesic: true,
    strokeColor: '#FF0000',
    strokeOpacity: 1.0,
    strokeWeight: 2
  });

  flightPath.setMap(map);

  satelliteGPS = [
  {lat:52.590117, lng:13.39915},
  {lat:52.437385, lng:13.553989}
  ];
   var satPath = new google.maps.Polyline({
    path: satelliteGPS,
    geodesic: true,
    strokeColor: '#FF0000',
    strokeOpacity: 1.0,
    strokeWeight: 2
  });

  satPath.setMap(map);

var markers = [
- HTML tail
];

for (i = 0; i < markers.length; i++) {
    marker = new google.maps.Marker({
        position: new google.maps.LatLng(markers[i][0], markers[i][1]),
        map: map,
        label: ''+markers[i][2],
    });}


}

    </script>
    <script async defer
        src="https://maps.googleapis.com/maps/api/js?key=AIzaSyA87riG059bu_a7cXr4z5ZgthV7sfttntg&signed_in=true&callback=initMap"></script>
  </body>
</html>